ONE Peanut Butter Pie Protein Bar vs Wilde Chicken & Himalayan Pink Salt Protein Chips
ONE Peanut Butter Pie Protein Bar edges ahead on a protein + calorie + rating blend. ONE Peanut Butter Pie Protein Bar scores higher in that blend because it offers more protein per serving (20g vs 10g), more protein per 100 calories (9.1g vs 7.7g), the stronger user rating (4.4 vs 4.0).
Full side-by-side of protein, calories, macros, and protein density for ONE Peanut Butter Pie Protein Bar and Wilde Chicken & Himalayan Pink Salt Protein Chips below.
ONE
Wins on: Protein, Fiber, Protein per 100 cal
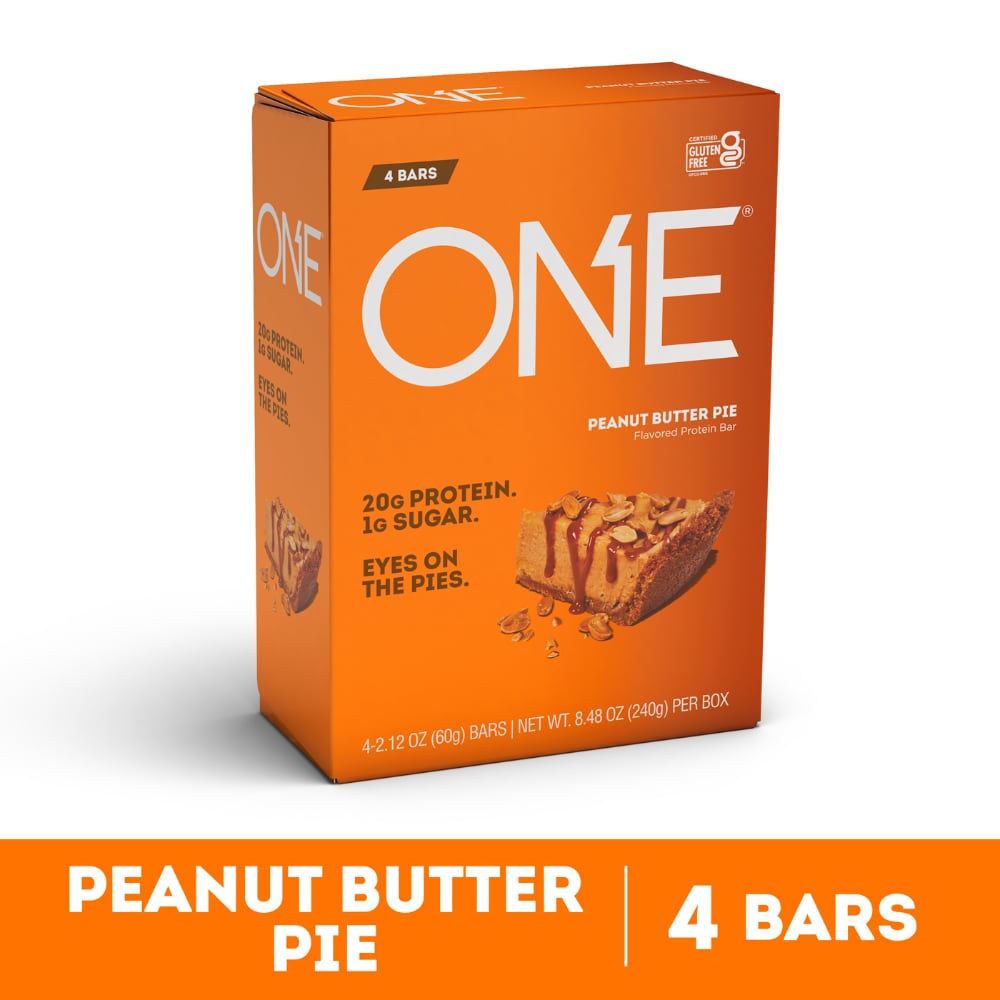
Protein
20g
Calories
220
Protein per 100 cal
9.1g
Pros
- More protein per serving: 20g vs 10g.
- Better protein density: 9.1g protein per 100 calories.
- Stronger shopper rating: 4.4 vs 4.0.
Cons
- Higher calorie count: 220 vs 130.
Wilde
Wins on: Calories, Sugar, Carbs, Fat
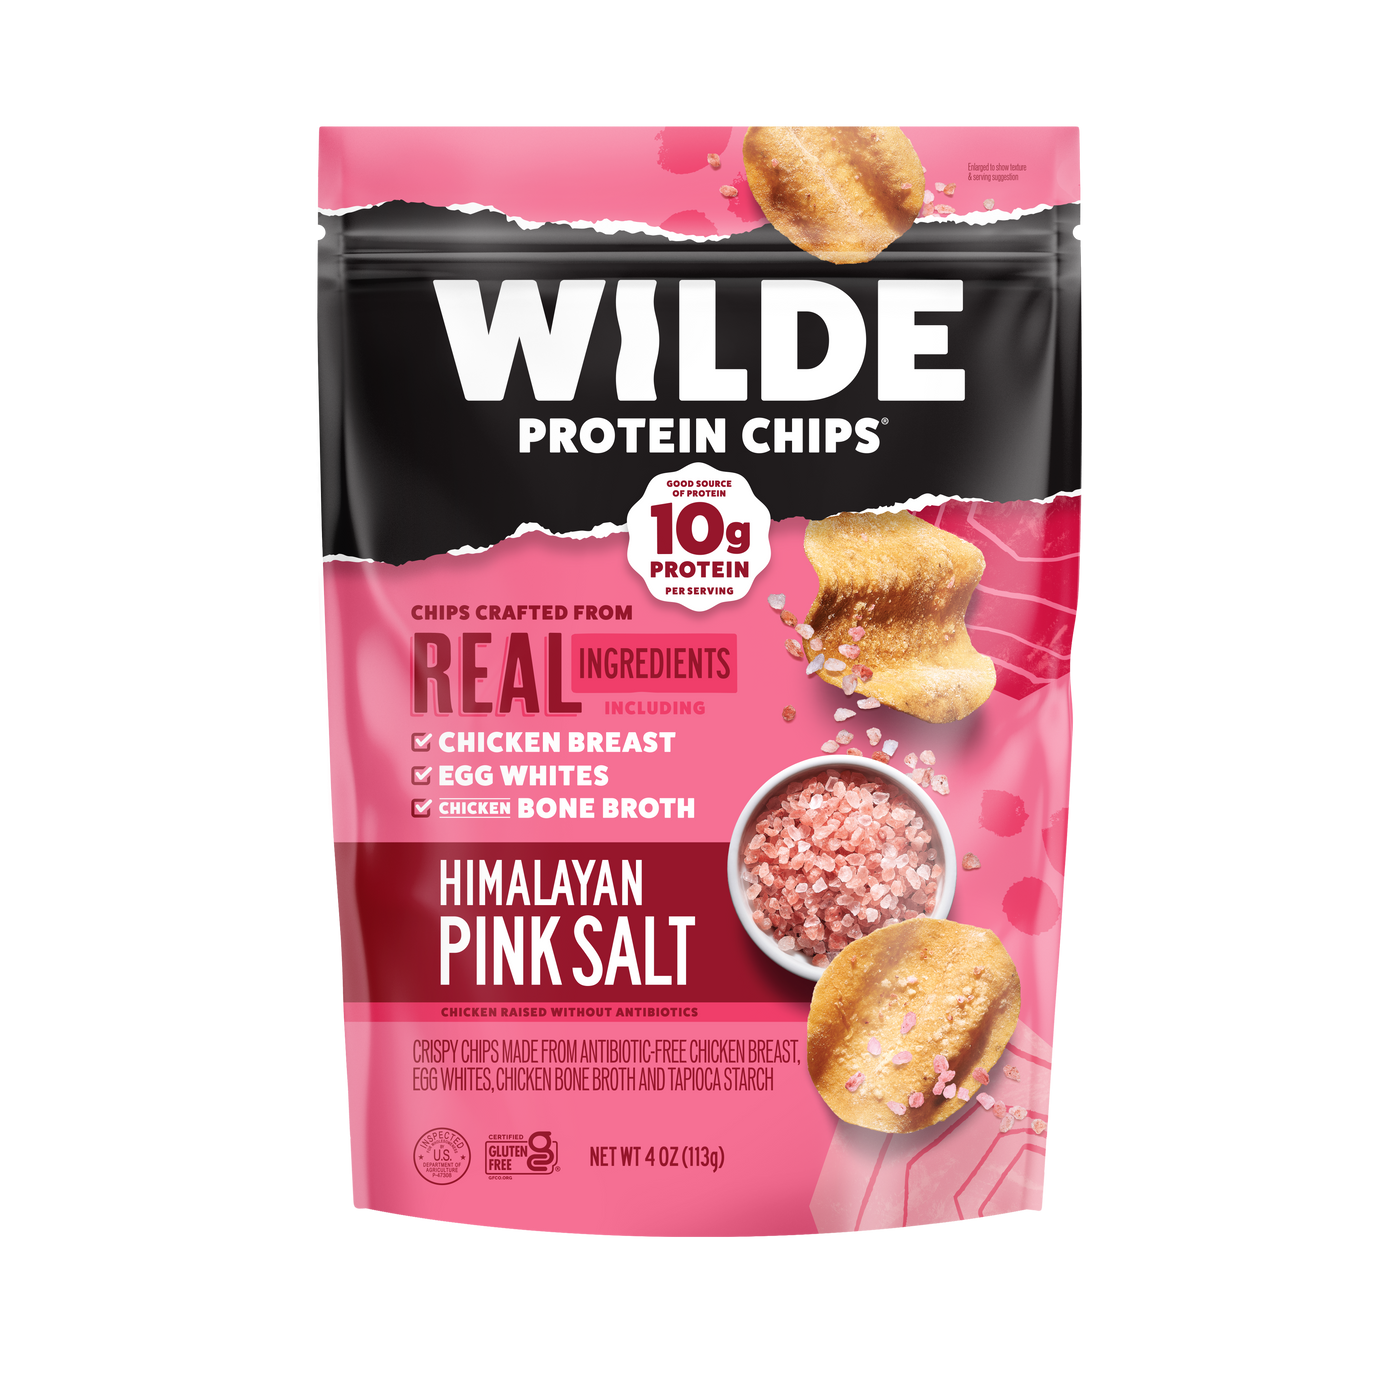
Protein
10g
Calories
130
Protein per 100 cal
7.7g
Pros
- Lower calorie load: 130 calories vs 220.
Cons
- Less protein per serving: 10g vs 20g.
- Lower protein density than ONE Peanut Butter Pie Protein Bar (7.7g vs 9.1g protein per 100 calories).
| Metric | ONE Peanut Butter Pie Protein Bar | Wilde Chicken & Himalayan Pink Salt Protein Chips |
|---|---|---|
| Protein | 20gBest | 10g |
| Calories | 220 | 130Best |
| Sugar | 1g | 0gBest |
| Fiber | 10gBest | 0g |
| Sodium | — | — |
| Carbs | 23g | 9gBest |
| Fat | 8g | 5gBest |
| Protein per 100 cal | 9.1gBest | 7.7g |
“Healthier” depends on your goal — here’s the real winner on every number we track, so two people with different priorities can both get the right answer.
- Protein: ONE Peanut Butter Pie Protein Bar wins, 20g vs 10g.
- Calories: Wilde Chicken & Himalayan Pink Salt Protein Chips wins, 130 vs 220.
- Sugar: Wilde Chicken & Himalayan Pink Salt Protein Chips wins, 0g vs 1g.
- Fiber: ONE Peanut Butter Pie Protein Bar wins, 10g vs 0g.
- Carbs: Wilde Chicken & Himalayan Pink Salt Protein Chips wins, 9g vs 23g.
- Fat: Wilde Chicken & Himalayan Pink Salt Protein Chips wins, 5g vs 8g.
- Protein per 100 cal: ONE Peanut Butter Pie Protein Bar wins, 9.1g vs 7.7g.
ONE Peanut Butter Pie Protein Bar edges ahead on a protein + calorie + rating blend.
ONE Peanut Butter Pie Protein Bar scores higher in that blend because it offers more protein per serving (20g vs 10g), more protein per 100 calories (9.1g vs 7.7g), the stronger user rating (4.4 vs 4.0). This blend won’t match your priorities if sugar, carbs, or diet fit matter more to you than protein, calories, and rating.
Frequently Asked Questions
ONE Peanut Butter Pie Protein Bar has more protein per serving: 20g versus 10g.
Wilde Chicken & Himalayan Pink Salt Protein Chips is the lighter option at 130 calories, compared with 220 calories for the alternative.
ONE Peanut Butter Pie Protein Bar is the more protein-dense pick at about 9.1g of protein per 100 calories.
"Healthier" depends on your goal: ONE Peanut Butter Pie Protein Bar has more protein (20g vs 10g); Wilde Chicken & Himalayan Pink Salt Protein Chips has less sugar (0g vs 1g); Wilde Chicken & Himalayan Pink Salt Protein Chips is lower in calories (130 vs 220). Neither is objectively the "healthiest" for everyone — see the pick-by-priority breakdown above, or try our free AI Snack Finder to get matched to your specific goal.
ONE Peanut Butter Pie Protein Bar edges ahead on a protein + calorie + rating blend. ONE Peanut Butter Pie Protein Bar scores higher in that blend because it offers more protein per serving (20g vs 10g), more protein per 100 calories (9.1g vs 7.7g), the stronger user rating (4.4 vs 4.0). They sit in different categories, so format and texture may matter as much as the raw macros.
Get weekly protein snack picks
Data-ranked comparisons and new picks. No spam — unsubscribe anytime.